Overview
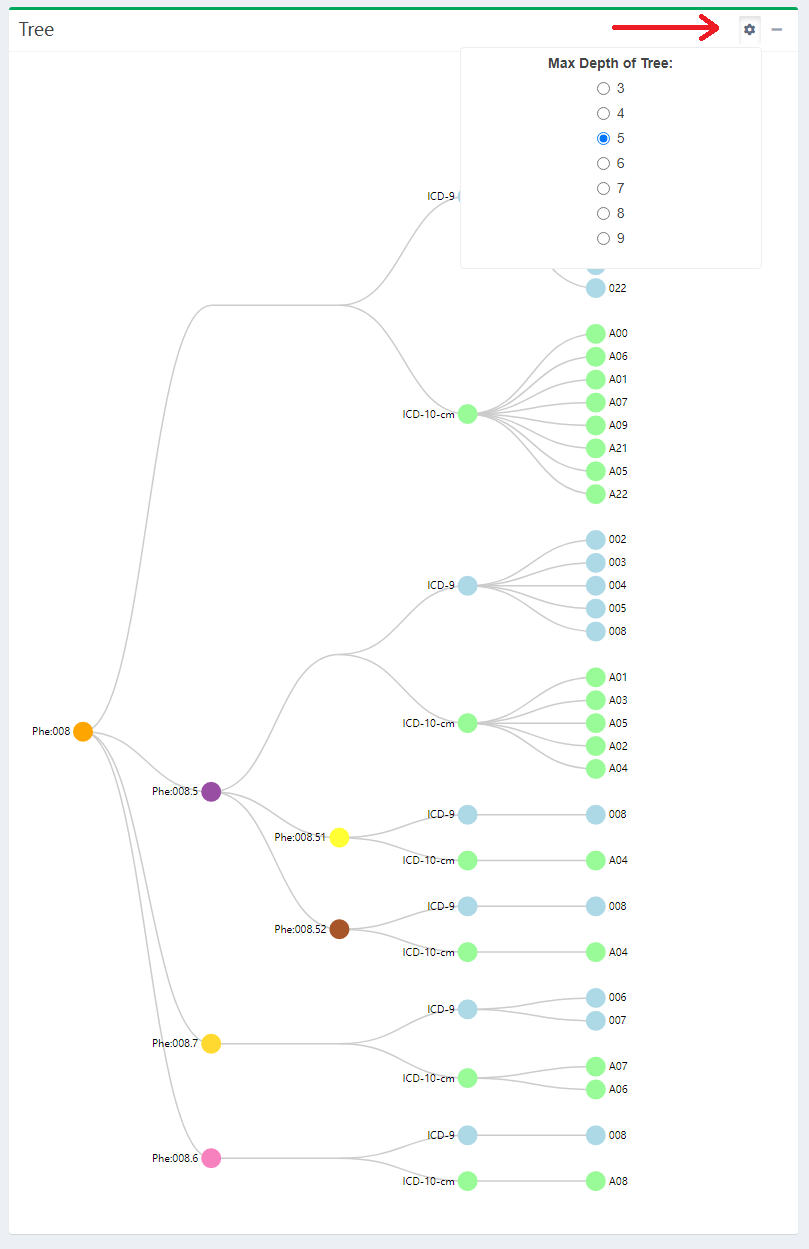
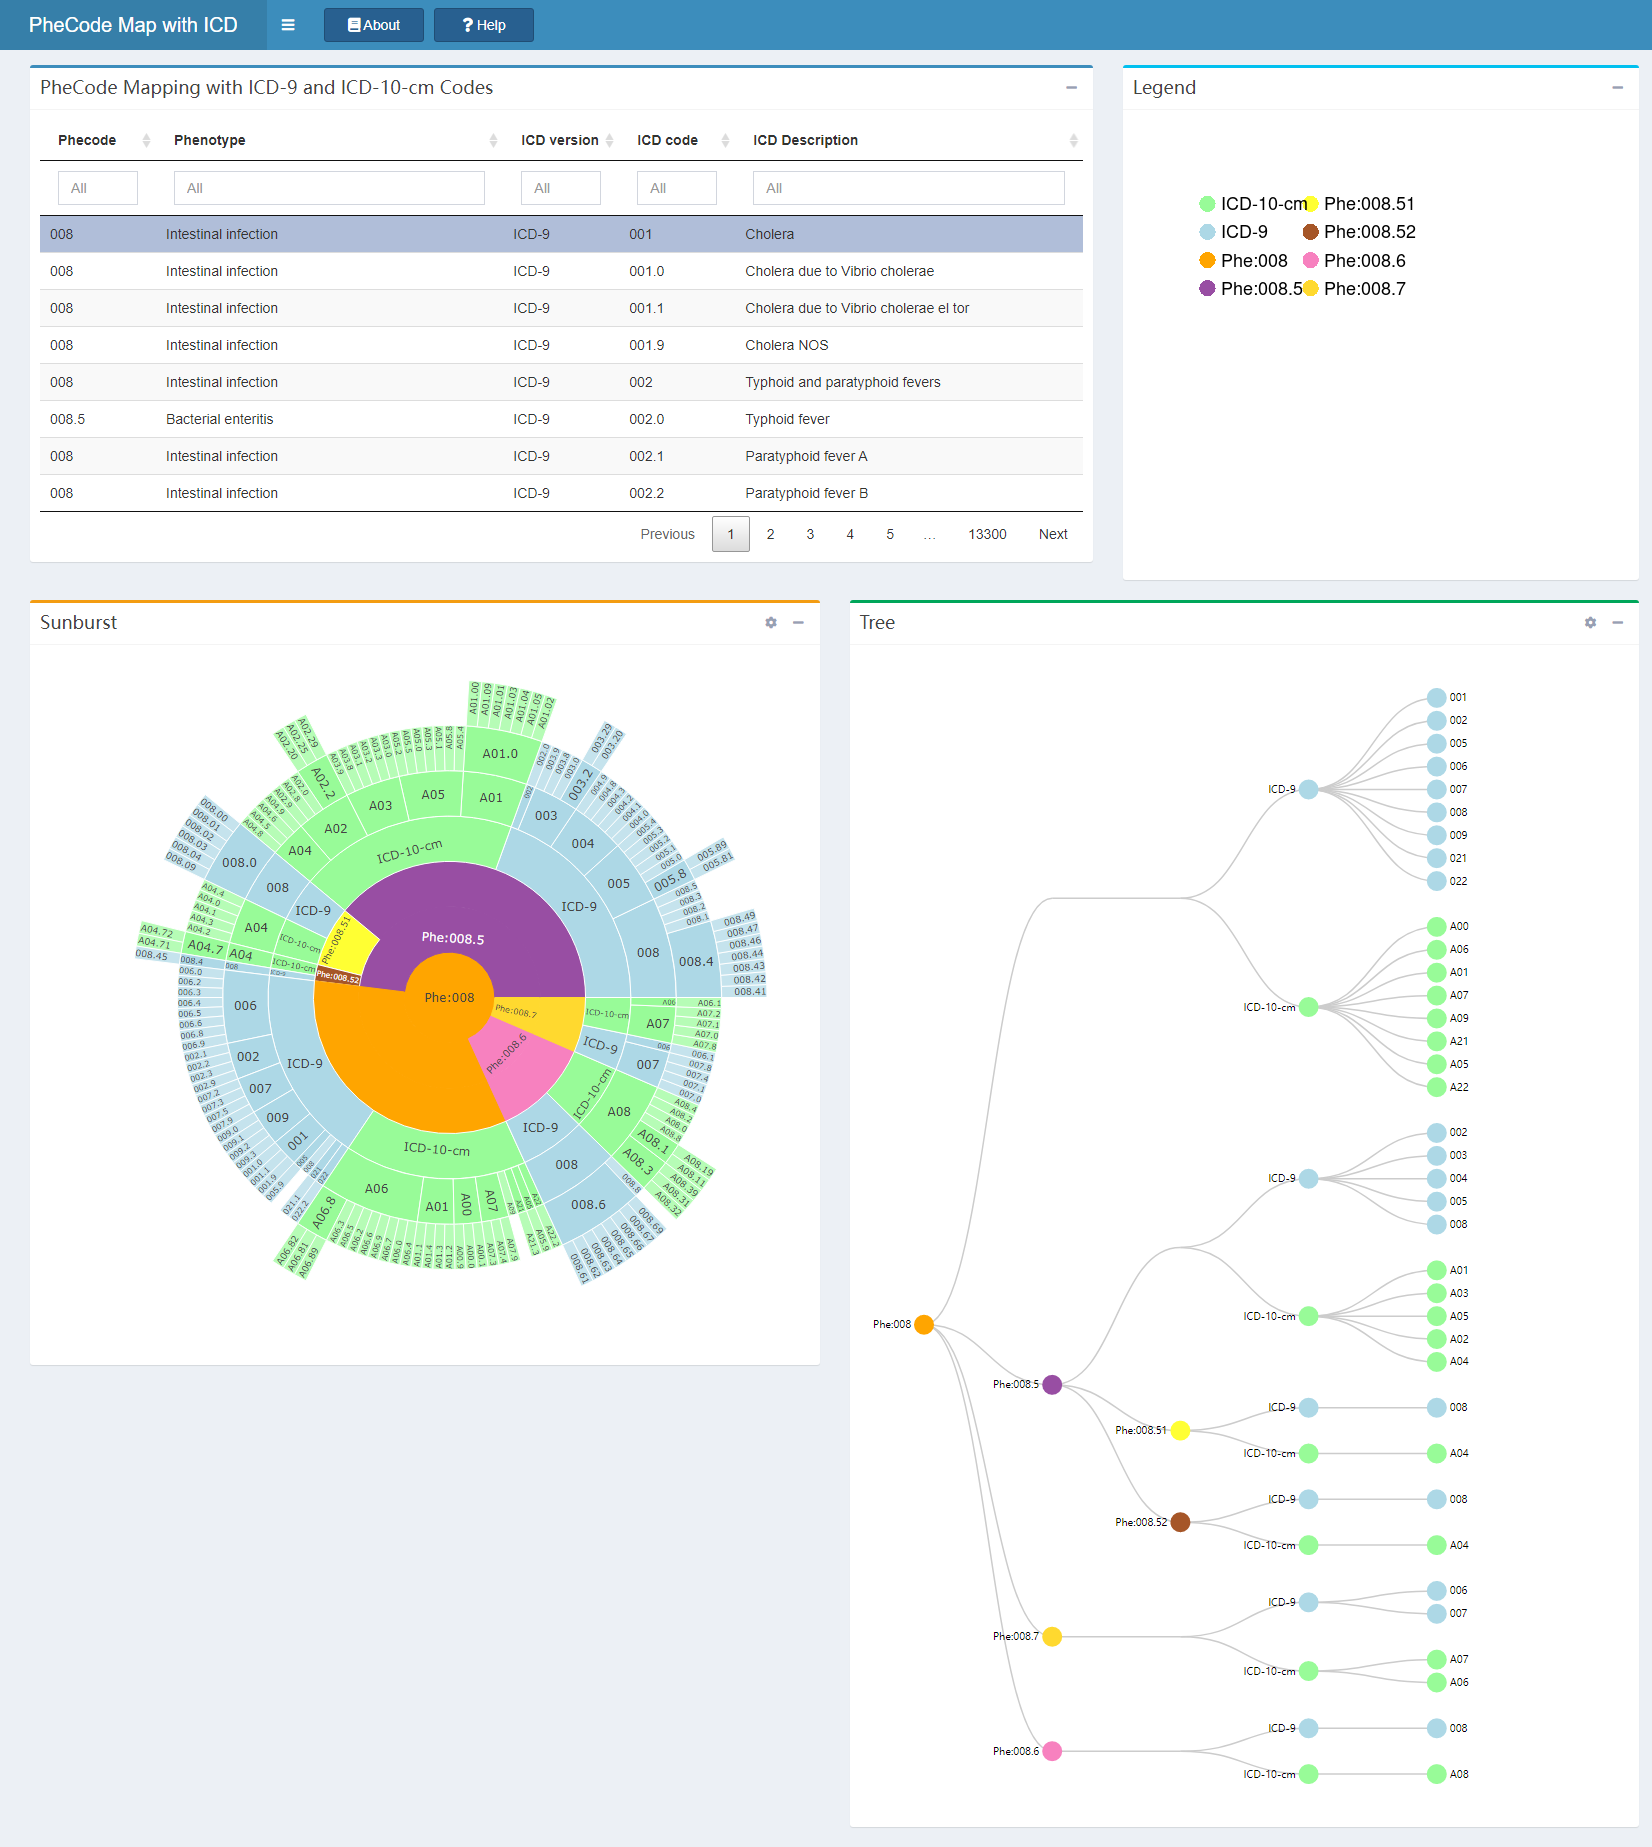
The phecodemap package builds a shiny app to visualize the hierarchy of PheCode Mapping with ICD-9 and ICD-10-cm. The same PheCode hierarchy is displayed in two ways: as a sunburst plot and as a tree.
There are 5 parts in the website: header, input table, legend, sunburst, tree plot.
header
- About: The instructions of the app.
- Help: The step-by-step introduction of the app.
The documentations of the About and Help are in inst/app/doc.
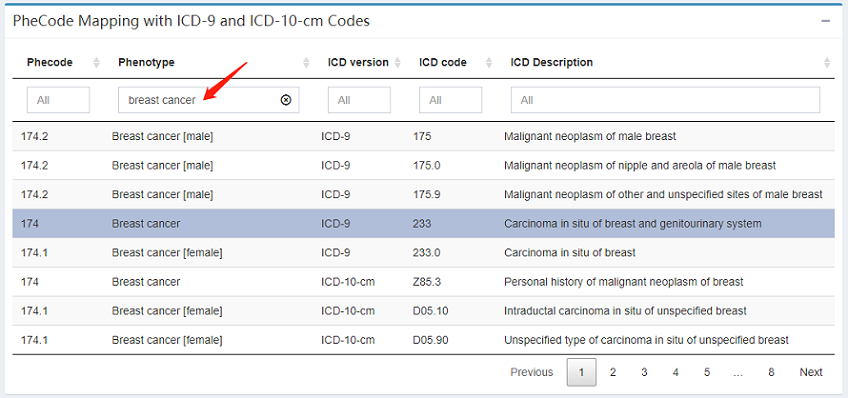
Input table
First of all, click a row in the input table. You can also enter some items in the filtering bar for each column (phenotype, ICD description etc.) to spot on your targets. Once a row are selected, the app will automatically display the hierarchy with the selected phecode as root node in the sunburst and tree plot.